The market had a gap-down opening and recorded a loss of more than one percent on August 2, snapping a five-day winning streak. The Nifty 50 failed to sustain the psychological 25,000 mark and closed 293 points down at 24,718 due to global weakness. According to experts, further weakness can't be ruled out. The immediate support for the index lies around 24,600-24,500, with crucial support at 24,100, while 24,800 is likely to be an immediate hurdle on the higher side. Here are 15 data points we have collated to help you spot profitable trades:
Key Levels for the Nifty 50
- Resistance based on pivot points: 24,733, 24,854, and 24,917
- Support based on pivot points: 24,689, 24,650, and 24,587
Special Formation
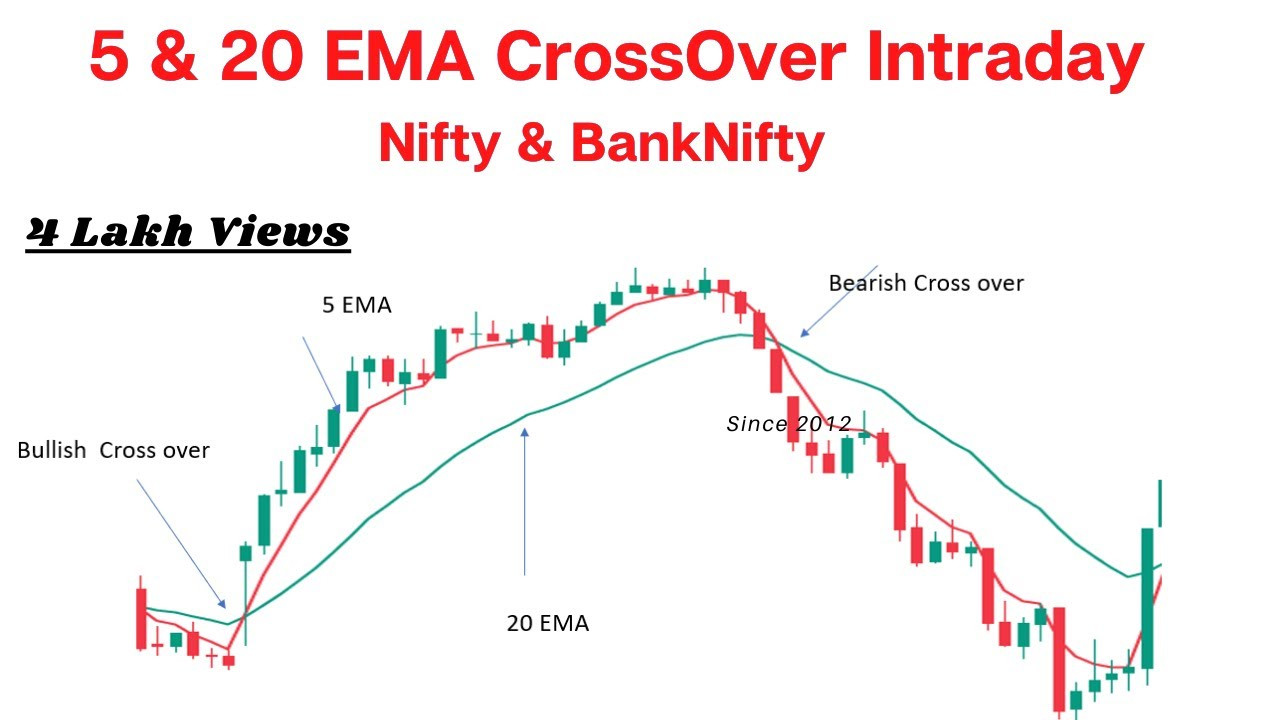
The Nifty 50 has broken down below the 10-day EMA (Exponential Moving Average) and formed a bearish candlestick pattern on the daily charts with higher volumes, while the momentum indicators RSI (Relative Strength Index) and MACD (Moving Average Convergence Divergence) show a negative crossover.
Key Levels for the Bank Nifty
- Resistance based on pivot points: 51,398, 51,671, and 51,870
- Support based on pivot points: 51,150, 51,027, and 50,828
- Resistance based on Fibonacci retracement: 51,895, 52,243
- Support based on Fibonacci retracement: 50,569, 49,724
Special Formation
The Bank Nifty has formed a bullish candlestick pattern with an upper shadow on the daily charts, despite a negative crossover in the momentum indicator RSI. The index fell 214 points to 51,350 but did not break the 50-day EMA (51,048) or the upward-sloping support trendline.
Nifty Call Options Data
According to the weekly options data, the 26,000 strike recorded the maximum open interest (with 89.97 lakh contracts). This level can act as a key resistance level for the Nifty in the short term. It was followed by the 25,000 strike (75.46 lakh contracts) and the 25,500 strike (66.8 lakh contracts).
Maximum Call writing was observed at the 24,800 strike, which saw an addition of 42.55 lakh contracts, followed by the 26,000 and 25,900 strikes, which added 36.19 lakh and 35.58 lakh contracts, respectively. The maximum Call unwinding was seen at the 24,100 strike, which shed 5,850 contracts, followed by the 23,500 and 23,800 strikes, which shed 5,050 and 2,475 contracts, respectively.
Nifty Put Options Data
On the Put side, the maximum open interest was seen at 24,000 strike (with 59.35 lakh contracts), which can act as a key support level for the Nifty. It was followed by the 24,100 strike (46.28 lakh contracts) and the 23,500 strike (43.29 lakh contracts).
The maximum Put writing was observed at the 24,100 strike, which saw an addition of 37.58 lakh contracts, followed by the 23,500 and 24,000 strikes, with 22.32 lakh and 14.54 lakh contracts added, respectively. The maximum Put unwinding was seen at 25,000 strike, which shed 19.93 lakh contracts, followed by the 24,900 and 25,100 strikes, which shed 7.45 lakh and 3.04 lakh contracts, respectively.
Bank Nifty Call Options Data
According to the weekly options data, the 52,000 strike holds the maximum open interest, with 29.1 lakh contracts. This can act as a key resistance level for the index in the short term. It was followed by the 53,000 strike (22.01 lakh contracts) and the 54,000 strike (17.63 lakh contracts).
Maximum Call writing was visible at the 51,500 strike (with the addition of 3.58 lakh contracts), followed by the 53,500 strike (3.45 lakh contracts) and the 53,000 strike (3.15 lakh contracts), while the Call unwinding was seen at the 51,700 strike, which shed 2.62 lakh contracts, followed by the 52,700 and 51,900 strikes, which shed 1.76 lakh and 87,900 contracts, respectively.
Bank Nifty Put Options Data
On the Put side, the maximum open interest was seen at the 50,000 strike (with 15.28 lakh contracts), which can act as a key support level for the index. This was followed by the 50,500 strike (14.66 lakh contracts) and the 51,000 strike (14.53 lakh contracts).
The maximum Put writing was observed at the 51,200 strike (which added 5.47 lakh contracts), followed by the 50,500 strike (5.43 lakh contracts) and the 51,000 strike (4.88 lakh contracts), while the Put unwinding was seen at the 51,700 strike, which shed 2.68 lakh contracts, followed by the 52,000 and 51,800 strikes, which shed 1.85 lakh and 1.73 lakh contracts, respectively.
Funds Flow
- Domestic institutional investors (DIIs) were net sellers to the tune of Rs 400 crore on August 2, while foreign portfolio investors (FPIs) were net buyers to the tune of Rs 1,000 crore.
- The FPI buying is positive for the market and suggests that there is a risk-on sentiment amongst global investors, despite the recent volatility in the markets.
- The DII selling is a concern, but it's worth noting that they have been selling for several weeks now. This selling could be due to various factors, including profit-taking or a shift in investment strategy.
- It will be important to watch the FII and DII activity in the coming days to gauge their overall sentiment towards the market.
Put-Call Ratio
The Nifty Put-Call ratio (PCR), which indicates the mood of the market, dropped to 0.91 on August 2, from 1.29 levels in the previous session. The increasing PCR, or being higher than 0.7 or surpassing 1, means traders are selling more Put options than Call options, which generally indicates the firming up of a bullish sentiment in the market. If the ratio falls below 0.7 or moves towards 0.5, then it indicates selling in Calls is higher than selling in Puts, reflecting a bearish mood in the market.
India VIX
Volatility increased sharply and climbed above 14 for the first time since July 22, creating discomfort for bulls last Friday. The India VIX, the fear gauge, jumped 10.75 percent to 14.32, up from 12.93 levels. If it climbs and sustains above the 16 mark, bulls may find the situation more unfavourable.
Long Build-up and Long Unwinding
- A long build-up was seen in 17 stocks. An increase in open interest (OI) and price indicates a build-up of long positions.
- 67 stocks saw a decline in open interest (OI) along with a fall in price, indicating long unwinding.
Short Build-up and Short-Covering
- 82 stocks saw an increase in OI along with a fall in price, indicating a build-up of short positions.
- 18 stocks saw short-covering, meaning a decrease in OI, along with a price increase.
High Delivery Trades
Here are the stocks that saw a high share of delivery trades. A high share of delivery reflects investing (as opposed to trading) interest in a stock.
Stocks Under F&O Ban
Securities banned under the F&O segment include companies where derivative contracts cross 95 percent of the market-wide position limit.
- Stocks added to F&O ban: Aditya Birla Capital, Chambal Fertilisers and Chemicals
- Stocks retained in F&O ban: Birlasoft, GNFC, Granules India, India Cements, IndiaMART InterMESH, RBL Bank
- Stocks removed from F&O ban: Nil
Disclaimer
The views and investment tips expressed by experts on Moneycontrol are their own and not those of the website or its management. Moneycontrol advises users to check with certified experts before taking any investment decisions.
Disclosure
Moneycontrol is a part of the Network18 group. Network18 is controlled by Independent Media Trust, of which Reliance Industries is the sole beneficiary.


