Wall Street's 'Fear Gauge' Surges to Highest Level Since 2020: What It Means for Investors
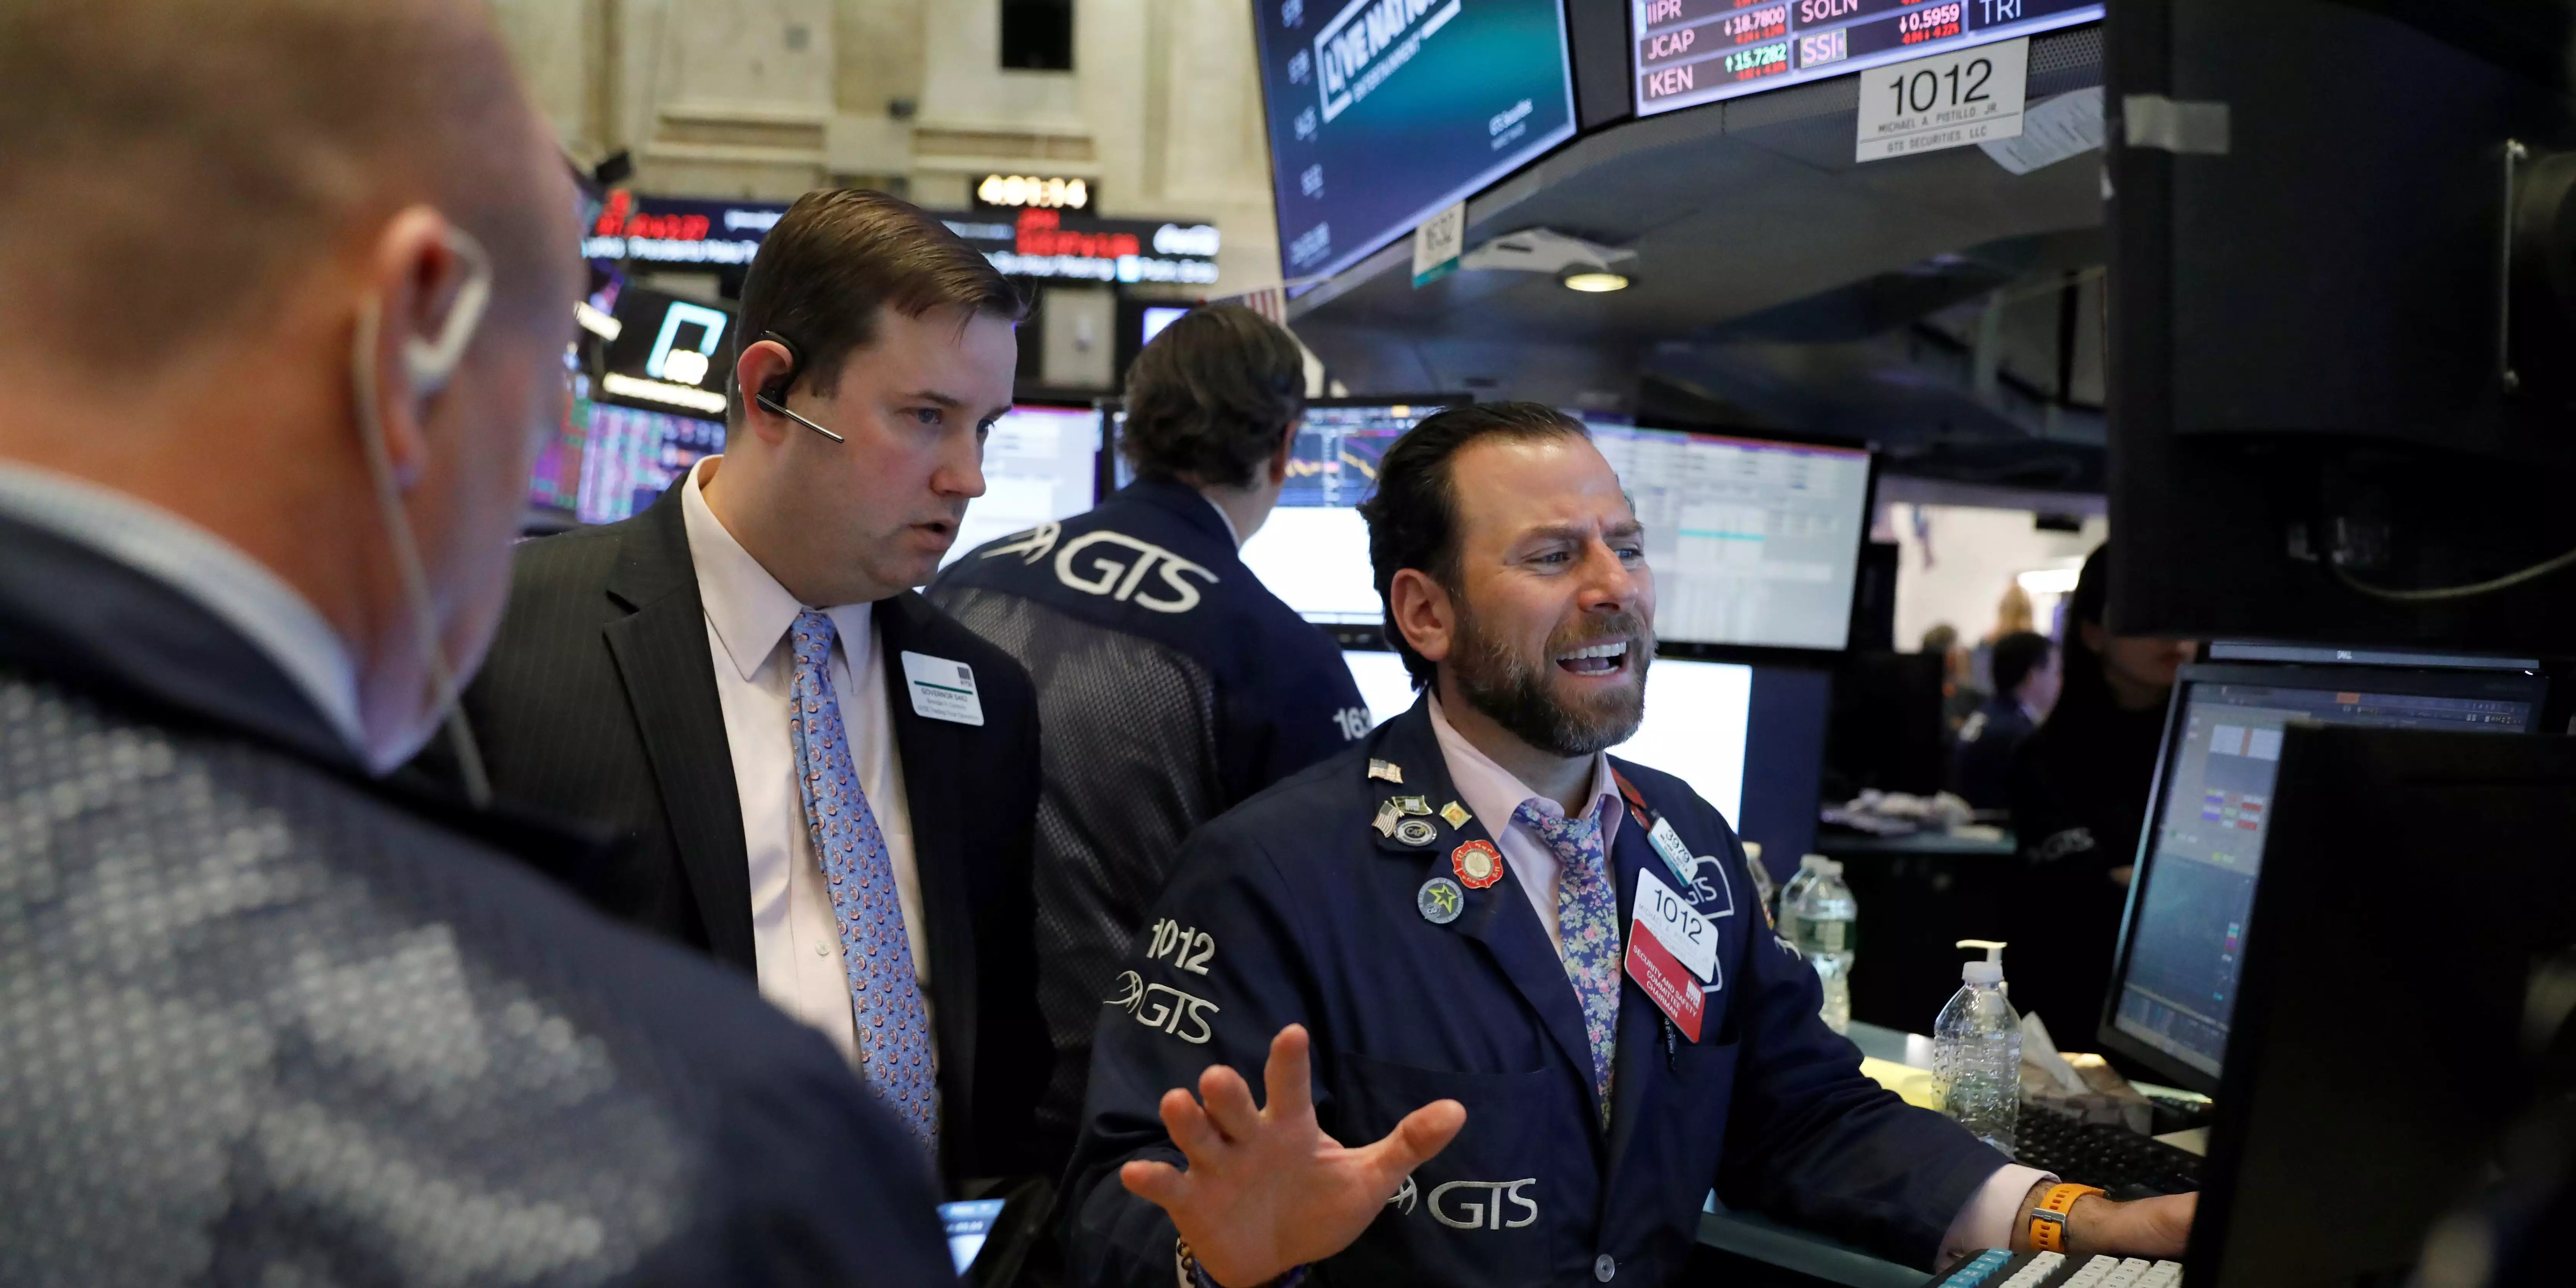
A key measure of expected volatility in the stock market surged to its highest level in more than four years on Monday morning as global equities fell sharply.
The Cboe Volatility Index, or VIX, briefly broke above 65 on Monday morning, up from about 23 on Friday and roughly 17 a week ago. It had cooled to around 38.6 by about 4 p.m. ET in New York, which would still be its highest closing level since 2020.
The Monday morning peak was the highest level the VIX has hit since March 2020, shortly after the Federal Reserve's emergency actions during the Covid-19 pandemic, according to FactSet. The VIX rose as high as 85.47 in March 2020, according to FactSet.
The VIX: A Reflection of Market Sentiment
Jim Carroll, senior wealth advisor with Ballast Rock Private Wealth, said that the size of the initial move on Monday could be a reflection of traders adding protection — or shifting out of short-term options into longer-term ones — during a period when the market struggled to meet that demand.
"It seems obvious, sitting where we sit now with VIX at 34-35 instead of 65, that we say an outside-of-regular-trading-hours squeeze. People were after those puts. They were chasing them. They couldn't get them. They kept chasing them," Carroll said late Monday morning. Put options are a type of derivative that traders use to add downside protection to their portfolios.
The VIX and Market Cycles
Since the Covid sell-off subsided, the VIX has been subdued, often trading below its longer-term average of 20. Some market experts have speculated that the proliferation of other types of derivatives, including increased trading in zero-day-to-expiration contracts, could be contributing to that.
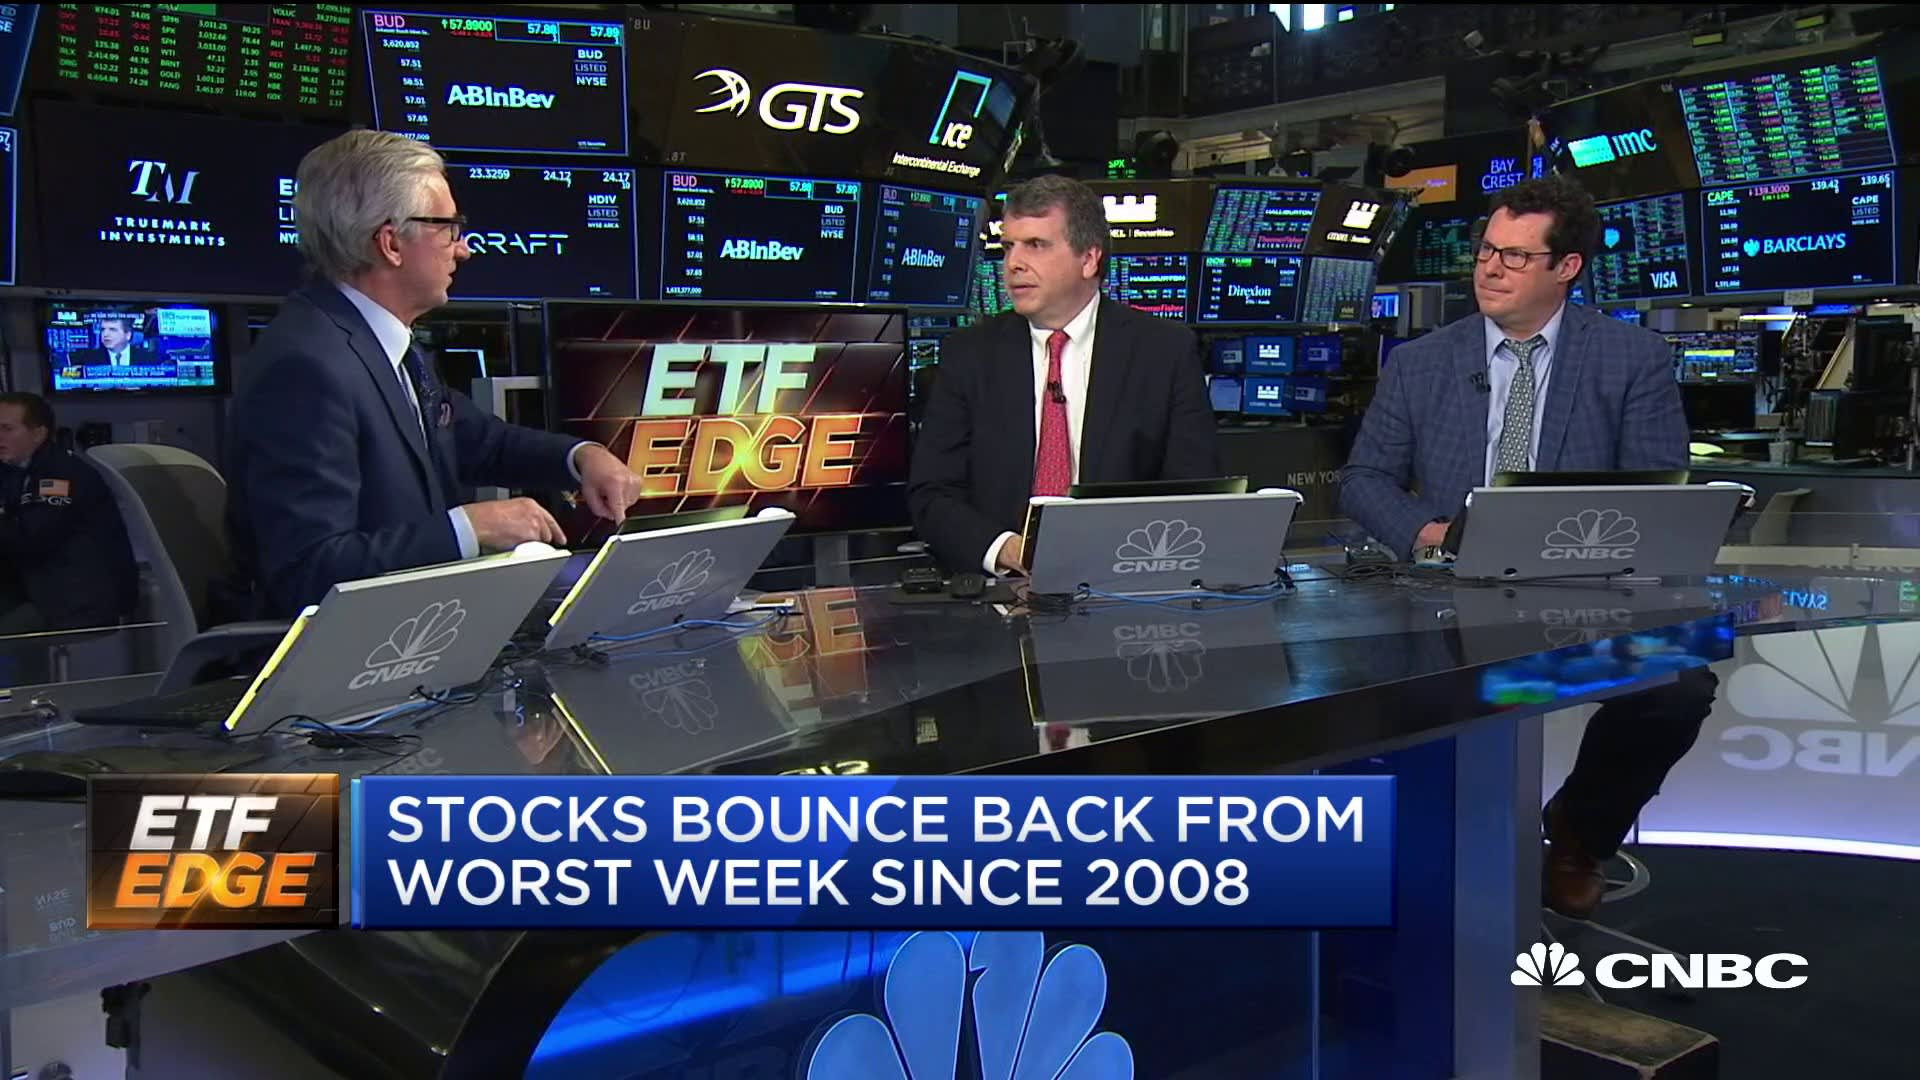
"You have to watch the VIX. When the VIX peaks and starts to roll over and fall down, the recovery can be just as quick," Fundstrat head of research Tom Lee said Monday on CNBC's "Squawk Box."
However, Carroll pointed out that the index also cooled during Friday's session, only to spike over the weekend, and said Monday's moves should not be viewed as an "all-clear" signal.
"If you just chopped off the long-tail at the top of the VIX candle right now and said, 'Hey, we're at 35.' We're at 35 relative to 23 on Friday's close — that's still a big move," Carroll said.
A Deeper Dive into the VIX Spike
The VIX climbed more than 142% to kick off the week, trading above 65. That’s almost double the previous 52-week high, and its highest intraday level since March 2020, when global stock markets crashed on fears of the COVID-19 pandemic.
Known as the “fear index” or “fear gauge,” the VIX reflects investors’ anxieties about market downturns. It’s calculated using the weighted prices of put and call options in the S&P 500 index for the next 30 days.
The Causes of the VIX Spike
Global stock markets were in the grips of a quickly intensifying rout on Monday. It started with Japan’s Nikkei 225 plunging 12% — its worst day since the 1987 Black Monday crash. In the U.S., Dow Jones Industrial Average futures fell more than 1,000 points, or 2.7%; S&P 500 futures dipped 3.6%; and Nasdaq-100 futures dropped 4.8%.
The culprit? Friday’s weaker-than-expected U.S. jobs report, that saw employers add just 114,000 jobs in July. This fell far short of the 175,000 gain economists had projected, according to estimates compiled by FactSet. At the same time, unemployment ticked up to 4.3%, it’s highest level in three years.
That data pointed to a slowing U.S. economy, and renewed concerns about a potential hard landing as opposed to a soft landing, when the central bank brings down inflation without tipping the economy into a recession.
It also raised concerns among investors about whether the Federal Reserve has waited too long to cut interest rates, which have sat at a 23-year high of between 5.25% and 5.5% for the past year. A September rate cut seems all but certain, given that inflation has continued to move towards the Fed’s 2% target in recent readings.
However, Monday’s rout could force central banks around the world into earlier rate cuts, with some traders at one point pricing in a 60% chance that the Fed carries out an emergency rate cut before September.
The Short-Volatility Trade and its Impact
(Bloomberg) -- The Monday meltdown across assets is hammering a slew of derivatives trades betting on enduring calm in the stock market — threatening to set off a chain reaction that could intensify the global turbulence.
Wall Street has for months been minting money with various strategies tied to stock tranquility, often via products that sell protective options in order to juice returns. But the scale of the boom in these so-called short volatility bets had stirred worries of what would happen when turbulence hit.
That test has now arrived. As stocks slid on Monday, the Cboe Volatility Index — Wall Street’s famous “fear gauge” that tracks options on the S&P 500 Index — surged as much as 42 points in the biggest one-day spike in data going back to 1990. It was up 10 points at 12:14 p.m. in New York at the highest on a closing basis since 2021. The benchmark equity index itself dropped as much as 4.3%.
While US stocks have been on a downward trajectory recently amid concern over the American economy, the scale of the moves is raising the specter that extreme options positioning could be compounding the drop.
“You have more options, more exposure, more people trading it, and more of a lean toward a short-volatility application,” said Kris Sidial, co-chief investment officer at Ambrus Group LLC, which offers hedging strategies. “When you get these de-leveraging effects, they’re going to be much more volatile than what we’ve historically seen.”
Short-Vol Trades and Market Amplification
Short-vol trades have ballooned since Covid as the options market overall has tripled in size. By effectively offering stock insurance, sellers have been able to easily pick up premiums for years as Federal Reserve rate hikes failed to spur any big spikes in volatility.
With swings now taking hold, there are several channels through which those strategies might exacerbate declines.
One path is via market makers, who generally take the other side of short-vol trades. These dealers need to hedge their positions in order to stay neutral, and in calm markets that helps dampen any stock swings.
But if volatility selling now shrinks and investors snap up more hedges, market makers will be in the opposite position, as seen during the Covid crash. Their new hedging needs could amplify daily moves, True Partner Capital wrote in a note last week.
“Such a capitulation moment would trigger additional sales of the underlying index,” the volatility hedge fund wrote. Market makers’ exposure also tends to change more quickly than in the past, the team said.
Another channel is via a popular subset of short-vol called the dispersion trade, which buys an array of single-stock options and sells similar contracts on the equity index. It is effectively a bet on different shares dancing to their own beat – or correlation staying low – which keeps a lid on the benchmark’s overall volatility as they cancel each other out.
Citigroup Inc. estimated earlier this year assets in the strategy have doubled or possibly even tripled over the last three years. But in a sign of growing pressure, Cboe’s three-month implied correlation index rose nearly nine points last week, its biggest surge since 2022, having fallen to the lowest since at least 2006 just a month ago.
“This can hurt dispersion positions where you’re long volatility but also short this correlation,” said Matthew Yeates, deputy chief investment officer at Seven Investment Management, which invests in a dispersion fund.
The exact performance of a trade will depend on its set-up, but the key point is that the market has moved against this approach. And anyone looking to unwind their exposure will likely have to buy index volatility, contributing to the turmoil.
The VIX: A Leading Indicator or Lagging Indicator?
Whether these kinds of money flows are trumping fundamentals is a debate as old as Wall Street, and the two are ultimately impossible to disentangle.
Yet the strength and speed of this selloff – just two weeks after US economic output soundly beat expectations – looks set to add fuel to the view that the mechanical effect of certain strategies is swaying modern markets more than ever before.
“The VIX surge (as we write it is now above 50) we suspect has been enhanced by some short volatility trades getting closed out,” Michael Purves, founder at Tallbacken Capital Advisors, wrote in a note. “We need to distinguish between trading leverage moving markets and what is happening fundamentally in the economy and with corporate earnings.”
What's Next for Investors?
The recent VIX spike serves as a stark reminder of the potential for unexpected market swings. Investors should be prepared for increased volatility and consider incorporating hedging strategies into their portfolios. Monitoring the VIX and other indicators of market sentiment can help investors make more informed decisions in navigating the current market landscape.


