Wall Street's 'Fear Gauge' Soars to Highest Level Since 2020 Amid Global Stock Market Rout
A key measure of expected volatility in the stock market surged to its highest level in more than four years on Monday morning as global equities fell sharply.
The Cboe Volatility Index, or VIX, briefly broke above 65 on Monday morning, up from about 23 on Friday and roughly 17 a week ago. It had cooled to about 32 shortly after noon ET.
The Monday morning peak was the highest level the VIX has hit since March 2020, shortly after the Federal Reserve's emergency actions during the Covid-19 pandemic, according to FactSet. The VIX rose as high as 85.47 in March 2020, according to FactSet.
The VIX is calculated based on market pricing for options on the S&P 500. It is designed to be a measure of expected volatility over the next 30 days, and is often referred to as Wall Street's "fear gauge."
Factors Driving the VIX Surge
The spike in the VIX on Monday was triggered by a confluence of factors, including:
- Weaker-than-expected U.S. jobs report: The July employment report showed that employers added just 114,000 jobs, far short of the 175,000 gain economists had projected. This raised concerns about a potential hard landing for the U.S. economy.
- Rising inflation concerns: While inflation has been trending downwards, investors are still concerned that the Federal Reserve has waited too long to cut interest rates. A September rate cut seems all but certain, but the recent economic weakness could force the Fed to act sooner.
- Escalating tensions in the Middle East: The conflict between Israel and Iran has heightened geopolitical uncertainty and added to market jitters.
- Carry trade unwinding: The Bank of Japan's recent interest rate hike has made the carry trade, a strategy that involves borrowing money in Japan and investing in assets abroad, less attractive. This has led to a sell-off in Japanese stocks and a strengthening of the yen.
Market Reactions
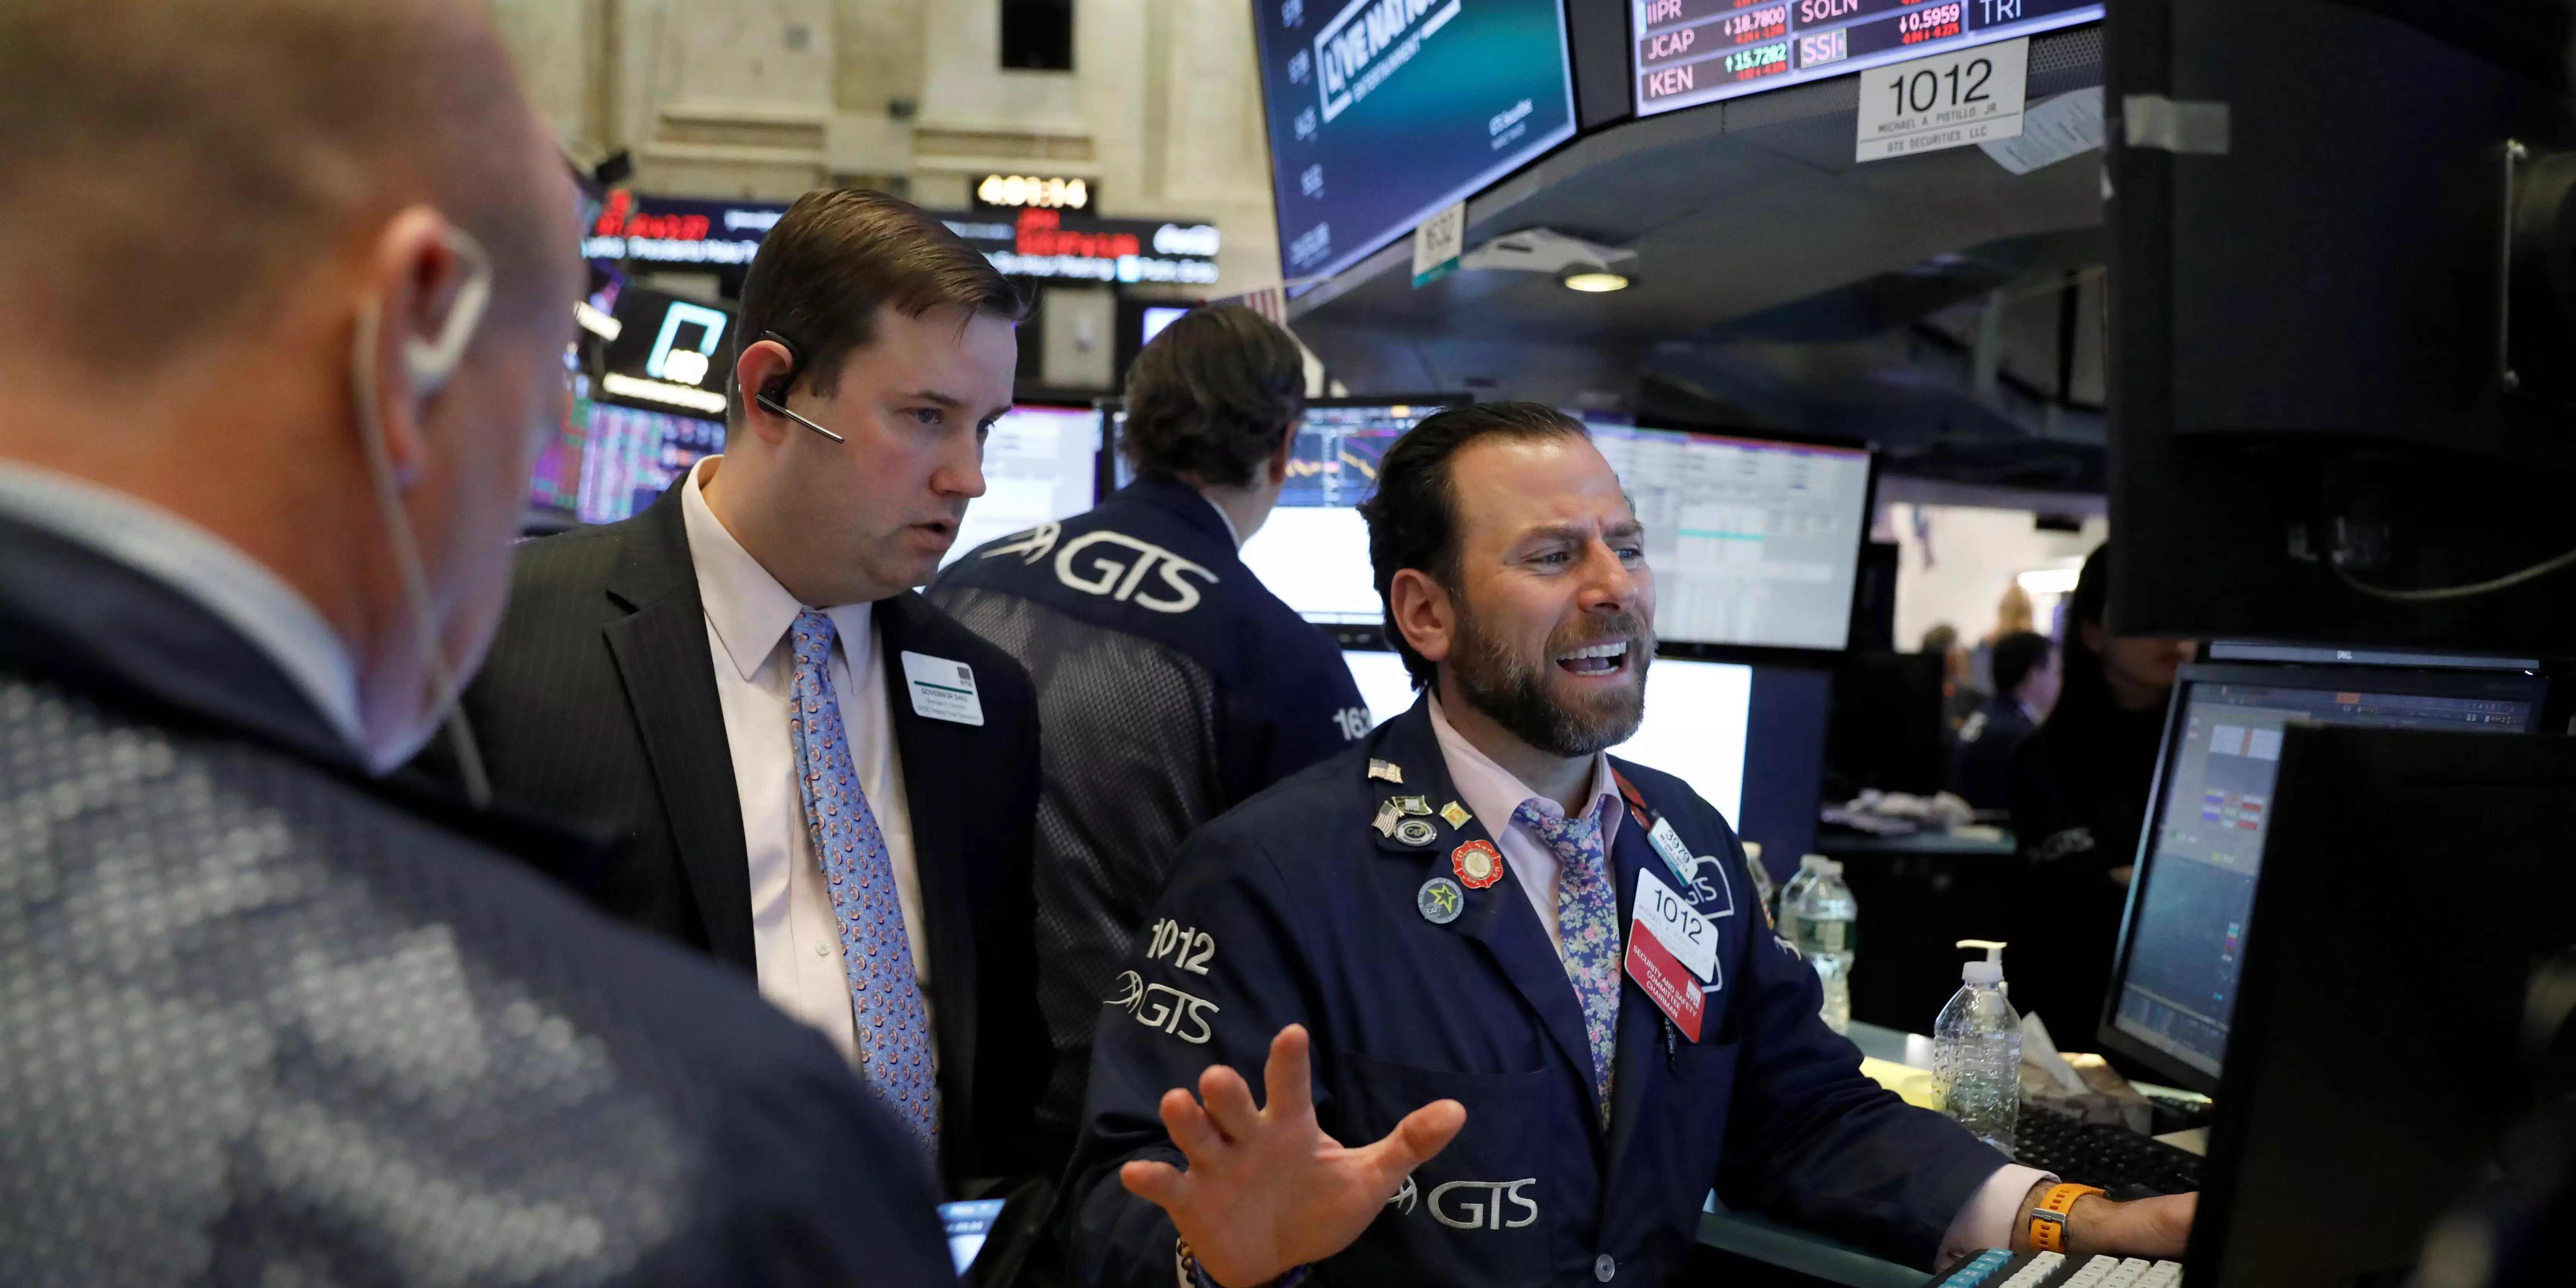
Global stock markets reacted sharply to the VIX surge, with major indices around the world falling sharply. The Dow Jones Industrial Average sank 2.5%, the S&P 500 fell 2.6%, and the tech-heavy Nasdaq Composite plummeted 2.9%. Japan's Nikkei 225 plunged 12% in its worst day since 1987.
Expert Opinions
Market experts have offered a variety of explanations for the VIX spike and the broader market sell-off. Some analysts believe that the sell-off is overdone and that the Fed will likely cut rates soon to support economic growth. Others are more cautious, warning that the market could continue to decline in the near term.
Paul Christopher, head of global investment strategy at Wells Fargo Investment Institute, said that investors are "fearful that the economy may weaken rapidly and want the Fed to cut rates aggressively to maintain economic growth." Jim Smigiel, chief investment officer at SEI, argued against an emergency rate cut, saying that it would "destroy policy maker credibility."
What's Next?
The VIX has calmed somewhat since its initial surge on Monday, but it remains elevated. Investors will be closely watching economic data, Fed policy, and geopolitical developments in the coming weeks for clues about the direction of the markets. It is still too early to say whether the current sell-off is a short-term correction or the beginning of a more prolonged downturn.
The Fear Gauge: A Signal of Investor Sentiment
The CBOE Volatility Index (VIX) is a key gauge of market sentiment and expected volatility. When the VIX rises, it indicates that investors are expecting more volatility and uncertainty in the markets. A high VIX reading can be a signal that investors are nervous and are likely to sell stocks. Conversely, a low VIX reading suggests that investors are relatively calm and are likely to hold onto their stocks.
The VIX is a valuable tool for investors because it can help them to gauge market sentiment and to make more informed investment decisions. However, it is important to note that the VIX is just one factor to consider when making investment decisions. Other factors, such as economic data, company fundamentals, and geopolitical events, should also be taken into account.
The VIX: A Reflection of Risk Aversion
The VIX can be seen as a reflection of risk aversion in the market. When investors are risk-averse, they are more likely to sell stocks and buy assets that are considered to be "safe havens," such as gold or U.S. Treasury bonds. This can lead to a decline in stock prices and a rise in the VIX.
The VIX is a complex and dynamic measure of market sentiment and volatility. It is important for investors to understand how the VIX is calculated and what it means in order to make more informed investment decisions. By tracking the VIX, investors can get a better sense of the overall risk appetite in the market and make more informed decisions about their portfolio allocations.


