Dow Jones Index Elliott Wave Analysis: A Bullish Forecast for the Market
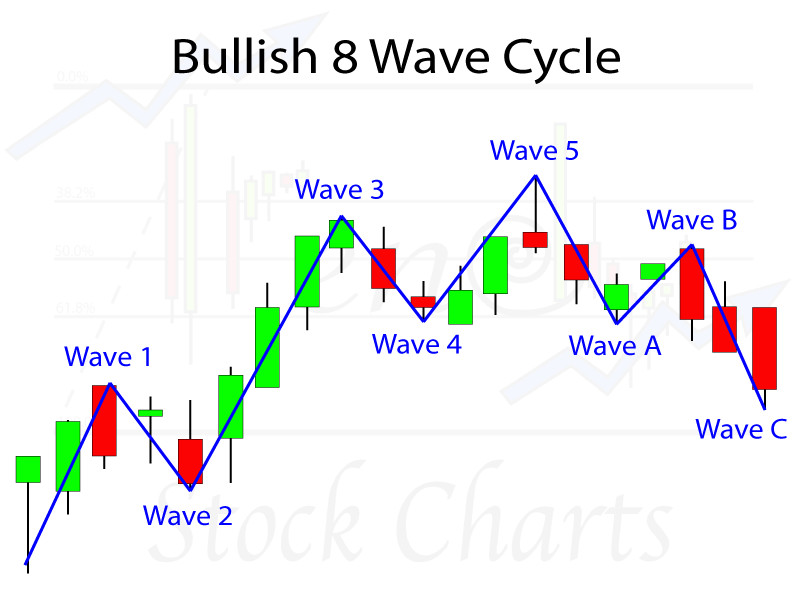
The Dow Jones Industrial Average, a widely recognized benchmark of the US stock market, is currently showing signs of bullish momentum according to the Elliott Wave analysis. This technical analysis method, developed by Ralph Nelson Elliott, interprets market trends by identifying recurring patterns in price movements.
The analysis suggests that the market is in an impulsive phase characterized by strong upward movement.
Daily Chart Analysis
The analysis of the daily chart reveals a clear trend, with the Dow Jones index currently positioned within orange wave 3, which is a continuation of the larger impulsive trend. This suggests that the market is likely to continue its upward trajectory in the near term.
Key Insights
- Orange wave 3: This is the third wave in the overall Elliott Wave sequence, typically the strongest and most extended wave. It often signifies significant market gains.
- Orange wave 2: The analysis indicates that orange wave 2 has already been completed, marking the end of a corrective phase and the start of a strong upward phase.
- Wave Cancel Invalid Level: A critical level set at 38900.53. A breach below this level would invalidate the current wave structure, necessitating a reassessment of the market's direction and wave count.
Weekly Chart Analysis
The weekly chart analysis further reinforces the bullish outlook for the Dow Jones index. The analysis shows that the market is positioned within navy blue wave 5, which is a continuation of the larger upward trend. This wave is expected to drive the market to new highs before a larger corrective phase takes place.
Key Insights
- Navy blue wave 5: This wave is the final wave in the impulsive sequence, often leading to the peak of the current trend.
- Navy blue wave 4: The completion of navy blue wave 4, which is a corrective phase, signifies the start of a new impulsive phase with navy blue wave 5 now in play.
- Wave Cancel Invalid Level: A critical level set at 38900.53. A breach below this level would invalidate the current wave structure, necessitating a reassessment of the market's direction and wave count.
Navigating the Bullish Market
While the Elliott Wave analysis suggests a bullish forecast for the Dow Jones index, it is crucial to remember that markets are dynamic and subject to various factors. The wave cancel invalid levels provide crucial insight into the market's trajectory. If the Dow Jones index falls below these levels, it would signal a potential change in the market's direction.
Conclusion: A Bullish Outlook for the Dow Jones
The Elliott Wave analysis of the Dow Jones index suggests a strong upward momentum for the market, driven by the current impulsive phases in the daily and weekly charts. The completion of corrective phases and the continued upward trajectory of the wave structure indicate a bullish outlook for the Dow Jones index. However, it is essential to monitor the market closely, especially the wave cancel invalid levels, for any potential changes in the market's direction.
Disclaimer:
The information provided in this article is for general informational purposes only and does not constitute investment advice. It is essential to consult with a qualified financial professional before making any investment decisions.
The information provided is based on the author's interpretation of the Elliott Wave analysis, and the author does not guarantee the accuracy or completeness of the analysis. The market is subject to various factors, and the actual performance of the Dow Jones index may deviate from the projections provided in this article. The author and FXStreet do not accept liability for any loss or damage that may arise from the use of or reliance on the information contained in this article.


